Sanderson M. Smith
Home | About Sanderson Smith | Writings and Reflections | Algebra 2 | AP Statistics | Statistics/Finance | Forum
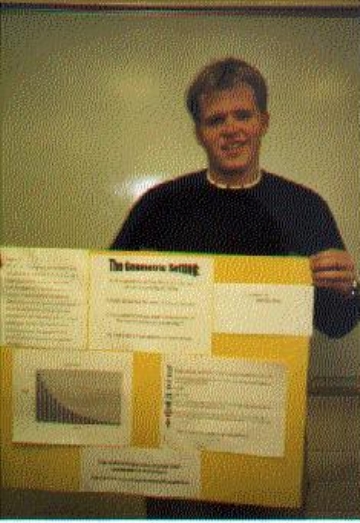
THE GEOMETRIC SETTING (MINI-PROJECT BY BRAD)
Brad's poster provides an explanation of the geometric setting along with an example.
The geometric setting:
Brad's graphics display relates to the random variable x, where x is the number of times a single die must be rolled until a 6 occurs. Possible values for x are 1,2,3,4,......
Here are some of the probabilities displayed in Brad's chart.
|
Value of x |
|
|
|
1/6 = 16.67% |
|
|
(5/6)(1/6) = 13.89% |
|
|
(5/6)2(1/6) = 11.57% |
|
|
(5/6)3(1/6) = 9.65% |
|
|
(5/6)4(1/6) = 8.04% |
|
|
(5/6)5(1/6) = 6.70% |
|
|
(5/6)6(1/6) = 5.58% |
|
|
(5/6)7(1/6) = 4.65% |
|
|
(5/6)8(1/6) = 3.88% |
|
|
(5/6)9(1/6) = 3.23% |
|
|
(5/6)10(1/6) = 2.69% |
|
|
(5/6)11(1/6) = 2.24% |
|
|
(5/6)12(1/6) = 1.87% |
|
|
(5/6)13(1/6) = 1.56% |
|
|
(5/6)14(1/6) = 1.30% |
|
|
(5/6)15(1/6) = 1.08% |
|
|
(5/6)16(1/6) = 0.90% |
|
|
(5/6)17(1/6) = 0.75% |
|
|
(5/6)18(1/6) = 0.63% |
|
|
(5/6)19(1/6) = 0.52% |
Home | About Sanderson Smith | Writings and Reflections | Algebra 2 | AP Statistics | Statistics/Finance | Forum
Previous Page | Print This Page
Copyright © 2003-2009 Sanderson Smith